back Reports schema
A description of the file formats of the different available reports.
Project and volume reports
Most report types can be requested for a whole project as well as for individual volumes. A project report is a convenience feature which requests reports for all individual volumes of the project at once and provides a ZIP file containing the volume reports for download. However, not all configuration options may be available for project reports.
The following sections describe the different types of volume reports but, per definition, apply for project reports as well.
Image annotation reports
Abundance
Similar to the extended report, this report is an XLSX spreadsheet that contains the abundances of each label and image. In this report, there is one row for each image and one column for each used label. If the annotations should be separated by label tree or user, there will be one worksheet for each label tree or user that was used.
For a single worksheet (not separated by label tree or user) the first line contains the volume name. For multiple worksheets the first lines contain the name of the respective label tree or user. The second line always contains the column headers. The columns are as follows:
- Image filename
- label name 1
- label name 2
- ...
Reports with more than 100,000 rows are split into multiple worksheets.
If "aggregate child labels" was enabled for this report, the abundances of all child labels will be added to the abundance of the highest parent label and the child labels will be excluded from the report.
If "all labels" was enabled for this report, all labels available to the volume will be included in the report, even if there are no annotations with these labels. This option is incompatible with the "restrict to newest label", "aggregate child labels" and "restrict to labels" options, which cannot be active at the same time.
AnnotationLocation
The image annotation annotation location report is a newline delimited GeoJSON file that contains the estimated positions of image annotations on a world map. This report can be used to import annotations in a GIS software such as QGIS. You can find a description of how to import and use a GeoJSON report in QGIS here.
The annotation position estimation is based on several assumptions. You can find a detailed description here.
The report contains one GeoJSON feature for each annotation label. This means that there may be multiple features for a single annotation if the annotation has multiple labels attached. The following properties are included for each feature:
- _id
The annotation label ID (unique for a GeoJSON feature). - _image_id
The ID of the image to which the annotation belongs. - _image_filename
The filename of the image to which the annotation belongs. - _image_latitude
The latitude coordinate of the image to which the annotation belongs. - _image_longitude
The longitude coordinate of the image to which the annotation belongs. - _label_name
The name of the label that belongs to the annotation label. - _label_id
The ID of the label that belongs to the annotation label.
Area
The image annotation area report is an XLSX spreadsheet of all area annotations (rectangle, circle, ellipse and polygon) with their width and height in pixels (px) and their area in px². Line string annotations are included, too, with the "width" set to the total length of the line string. If a laser point detection was performed, the width and height in m and the area in m² is included as well.
For a single worksheet (not separated by label tree or user) the first line contains the volume name. For multiple worksheets the first lines contain the name of the respective label tree or user. The second line always contains the column headers. The columns are as follows:
- Annotation ID
- Annotation shape ID
- Annotation shape name
- Label IDs comma separated list of IDs of all labels that are attached to the annotation
- Label names comma separated list of names of all labels that are attached to the annotation
- Image ID
- Image filename
- Annotation width (m) Rectangle: the longer edge. Circle: the diameter. Ellipse: Length of the major axis. Polygon: width of the minimum (non-rotated) bounding rectangle. Line string: total length.
- Annotation height (m) Rectangle: the shorter edge. Circle: the diameter. Ellipse: Length of the minor axis. Polygon: height of the minimum (non-rotated) bounding rectangle. Line string: always 0.
- Annotation area (m²)
- Annotation width (px) See the width in m for the interpretation of this value for different shapes.
- Annotation height (px) See the height in m for the interpretation of this value for different shapes.
- Annotation area (px²)
Reports with more than 100,000 rows are split into multiple worksheets.
Basic
The basic image annotation report contains a graphical plot of abundances of the different annotation labels (annotations can have multiple labels by different users). If the annotations should be separated by label tree or user, there will be one plot for each label tree or user.
Example plot:
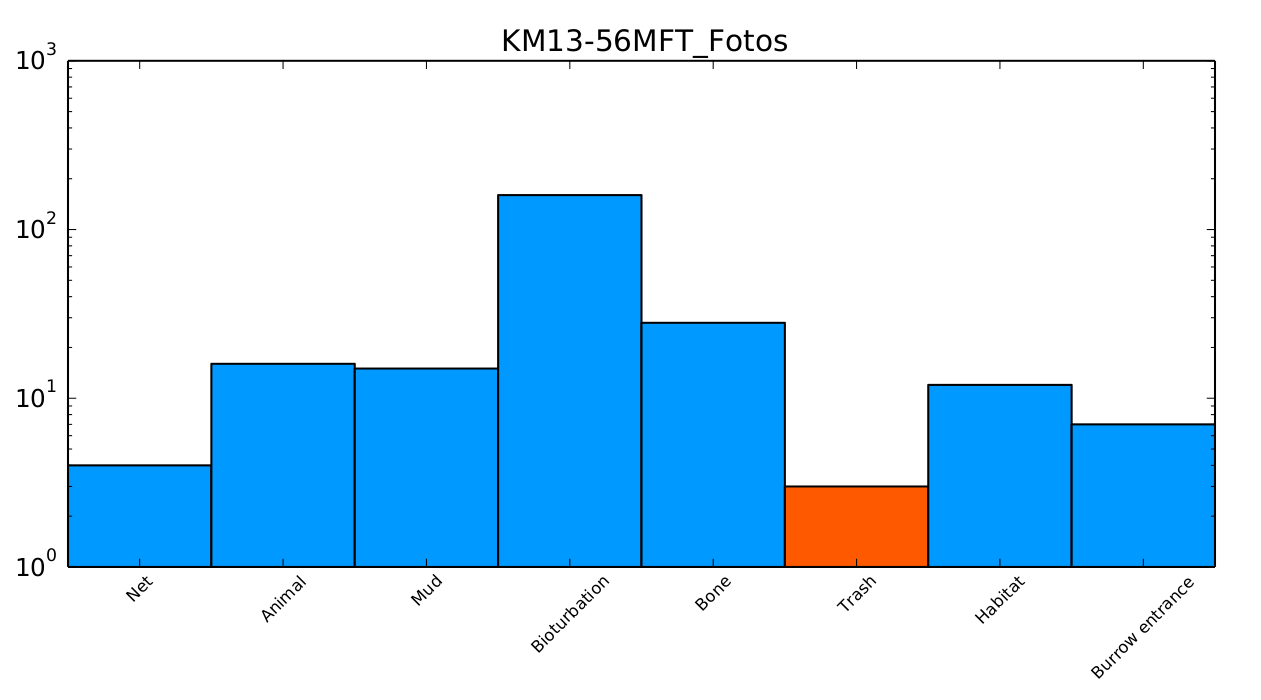
The bars of the plot are color-coded based on the colors of the labels they represent. If any label occurs more than a hundred times, a logarithmic scale is applied.
CSV
The CSV report is intended for subsequent processing. If you want the data in a machine readable format, choose this report. The report is a ZIP archive, containing a CSV file. The CSV file name consists of the volume ID and the volume name (cleaned up so it can be a file name) separated by an underscore. If the image annotations should be separated by label tree or user, there will be one CSV file for each label tree or user and the CSV file name will consist of the label tree or user ID and name instead.
Each CSV file contains one row for each annotation label. Since an annotation can have multiple labels, there may be multiple rows for a single annotation. The first row always contains the column headers. The columns are as follows:
- Annotation label ID (not the annotation ID)
- Label ID
- Label name
- Label hierarchy (see the extended report on how to interpret a label hierarchy)
- ID of the user who created/attached the annotation label
- User firstname
- User lastname
- Image ID
- Image filename
- Image longitude
- Image latitude
- Annotation shape ID
- Annotation shape name
-
Annotation points
The annotation points are encoded as a JSON array of alternating x and y values (e.g.
[x1,y1,x2,y2,...]). For circles, the third value of the points array is the radius of the circle. -
Additional attributes of the image
The additional attributes of the image are encoded as a JSON object. The content may vary depending on the BIIGLE modules that are installed and the operations performed on the image (e.g. a laser point detection to calculate the area of an image). This column can be hidden via the
Hide the attributes columncheckbox. - Annotation ID
- Creation date (of the annotation label)
Extended
The extended image annotation report is an XLSX spreadsheet which contains a list of the abundances of each label and image. If the annotations should be separated by label tree or user, there will be one worksheet for each label tree or user. Reports with more than 100,000 rows are also split into multiple worksheets.
For a single worksheet (not separated by label tree or user) the first line contains the volume name. For multiple worksheets the first lines contain the name of the respective label tree or user. The second line always contains the column headers. The columns are as follows:
- Image filename
-
Label hierarchy
The label hierarchy contains all label names from the root label to the child label, separated by a
>. If we have the following label tree:Animalia └─ Annelida └─ Polychaeta └─ Buskiella spThen the content of the "label hierarchy" column for annotations with the label "Buskiella sp" will beAnimalia > Annelida > Polychaeta > Buskiella sp. - Label abundance
Coco
The Coco file format is a common format for machine learning applications. The data is stored in a JSON file, which is readable by most deep learning frameworks. For more information please have a look at this article. Point annotations are incompatible and will not be included in this report. All remaining annotations will be transformed to polygons which might cause slight changes in their appearance.
Full
The full image annotation report is an XLSX spreadsheet similar to the extended report. It contains a list of all annotations and their labels.
The columns are as follows:
- Image filename
- Annotation ID
- Annotation shape name
- X-Coordinate(s) of the annotation (may span multiple lines)
- Y-Coordinate(s) of the annotation (may span multiple lines)
- Comma separated list of label hierarchies (see the extended report on how to interpret a label hierarchy)
- The area of the image in m² if available
For the different annotation shapes, the coordinates are interpreted as follows:
- Point: The x and y coordinates are the location of the point on the image.
- Rectangle: Each line contains the x and y coordinates of one of the four vertices describing the rectangle.
- Circle: The first line contains the x and y coordinates of the center of the circle. The x value of the second line is the radius of the circle.
- Ellipse: Similar to the rectangle. The first two vertices are the end points of the major axis. The next two vertices are the end points of the minor axis.
- Line string: Each line contains the x and y coordinates of one of the vertices describing the line string.
- Polygon: Each line contains the x and y coordinates of one of the vertices describing the polygon.
ImageLocation
The image annotation image location report is a newline delimited GeoJSON file that contains image positions as points on a world map. This report can be used to import image positions in a GIS software such as QGIS. You can find a description of how to import and use a GeoJSON report in QGIS here.
The report contains one GeoJSON feature for each image. The following properties are included for each feature:
- _id
The image ID (unique for a GeoJSON feature). - _filename
The filename of the image. - Additional properties list the number of annotations with a certain label for each image. The format of the property title is "label_name (#label_id)"
Image label reports
Basic
The basic image label report is an XLSX spreadsheet similar to the extended annotation report. It contains a list of all labels attached to each image of the volume. The columns are as follows:
- Image ID
- Image filename
- Comma separated list of label hierarchies (see the extended annotation report on how to interpret a label hierarchy)
CSV
The CSV report is similar to the annotation CSV report. If you want the data in a machine readable format, choose this report.
Each CSV file contains one row for each image label. Since an image can have multiple different labels, there may be multiple rows for a single image. The columns are as follows:
- Image label ID
- Image ID
- Image filename
- Image longitude
- Image latitude
- ID of the user who attached the image label
- User firstname
- User lastname
- Label ID
- Label name
- Label hierarchy (see the extended annotation report on how to interpret a label hierarchy)
- Creation date
ImageLocation
The image label image location report is a newline delimited GeoJSON file that contains image positions as points on a world map. This report can be used to import image positions in a GIS software such as QGIS. You can find a description of how to import and use a GeoJSON report in QGIS here.
The report contains one GeoJSON feature for each image. The following properties are included for each feature:
- _id
The image ID (unique for a GeoJSON feature). - _filename
The filename of the image. - Additional properties list the image labels that have been used in the volume and whether a label was attached to an image (
1) or not (0). The format of the property title is "label_name (#label_id)"
Video annotation reports
CSV
The CSV report is similar to the annotation CSV report.
Each CSV file contains one row for each video annotation label. Since a video annotation can have multiple different labels, there may be multiple rows for a single video annotation. The columns are as follows:
- Video annotation label ID (not the video annotation ID)
- Label ID
- Label name
- Label hierarchy (see the extended report on how to interpret a label hierarchy)
- ID of the user who created/attached the video annotation label
- User firstname
- User lastname
- Video ID
- Video filename
- Video annotation shape ID
- Video annotation shape name
-
Video annotation points
The video annotation points are encoded as nested JSON arrays of alternating x and y values (e.g.
[[x11,y11,x12,y12,...],[x21,y21,...],...]). Each array describes the video annotation for a specific key frame (time). For circles, the third value of the points array is the radius of the circle. An empty array means there is a gap in the video annotation. -
Video annotation key frames
The key frames are encoded as a JSON array. Each key frame represents a time in seconds that corresponds to the ponts array at the same index.
nullmeans there is a gap in the video annotation. - Video annotation ID
- Creation date (of the video annotation label)
-
Additional attributes of the video
The additional attributes of the video are encoded as a JSON object. The content may vary depending on the BIIGLE modules that are installed and the available metadata for the video. (e.g. MIME type, size, width and height). This column can be hidden via the
Hide the attributes columncheckbox.
Video label reports
CSV
Each CSV file contains one row for each video label. Since a video can have multiple different labels, there may be multiple rows for a single video. The columns are as follows:
- Video label ID
- Video ID
- Video filename
- ID of the user who attached the video label
- User firstname
- User lastname
- Label ID
- Label name
- Label hierarchy (see the extended annotation report on how to interpret a label hierarchy)
- Creation date
iFDO reports
iFDO reports can be requested if an iFDO file has been uploaded for a volume. The iFDO report will be generated as the original file with additional information on the annotations and image/video labels that were created in BIIGLE. Optionally, annotations and image/video labels of the original file can be excluded from the report.